← All workSchema Design / Data visualization
PEFA Assessment
Visualize financial assessments for countries
Project Overview
At Schema Design, I was assigned to work for PEFA, an interactional organization under World Bank.
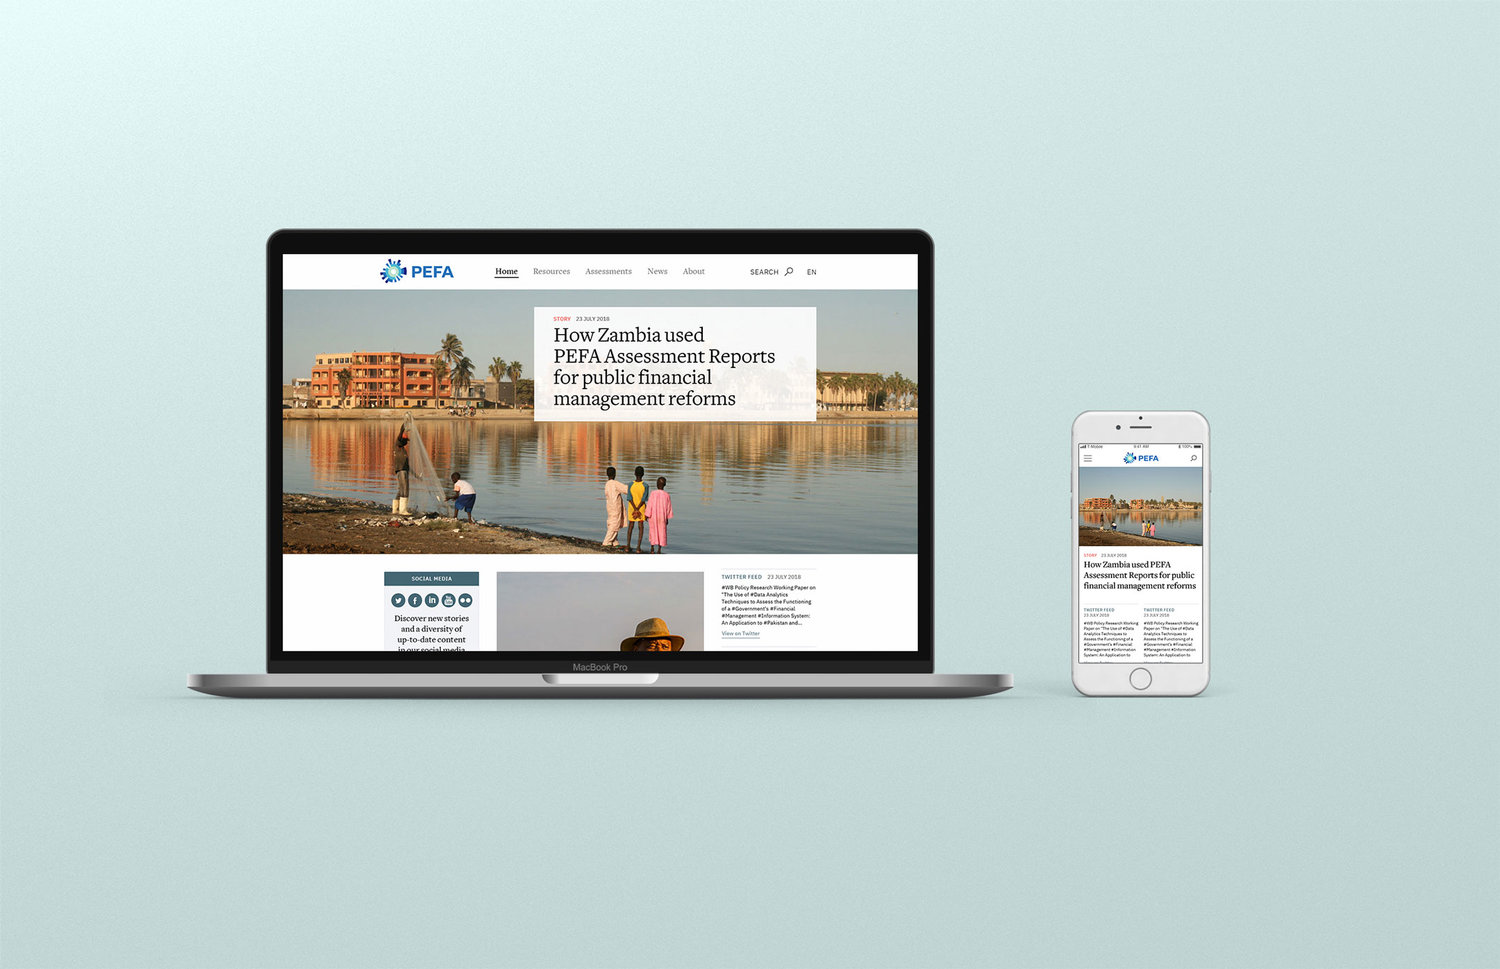
Public Expenditure and Financial Accountability (PEFA) is a tool for assessing the status of public financial management (of countries or regions). A PEFA assessment provides a thorough, consistent and evidence-based analysis of PFM performance at a specific point in time. In this project, our goal was to redesign PEFA's website with new IA and visual system, on desktop and mobile.
PEFA is now available here.
Public Expenditure and Financial Accountability (PEFA) is a tool for assessing the status of public financial management (of countries or regions). A PEFA assessment provides a thorough, consistent and evidence-based analysis of PFM performance at a specific point in time. In this project, our goal was to redesign PEFA's website with new IA and visual system, on desktop and mobile.
PEFA is now available here.
My Contributions
With 1 creative director and 1 visual designer, I led user interviews, explored various data visualization solutions, made part of desktop screens, all mobile screens, and InVision Prototype for desktop/mobile. Highlights:
- Information Design, , Interaction design, UX Research,
- Mobile design
- Interaction design
- UX Research
- Interactive Prototypes and Videos
Timeline
2018.10 - 2019.02
TOOLS
Sketch, Illustrator, InVision, Flinto
Design Challenge
How might we empower researchers to explore and compare countries/regions’ financial performance at an abstract level and at a detailed level?
- PEFA website’s information architecture hides the important data sheets/documents that users wish they had access to.
- Each assessment page has a long list of scores of a country/region’s scoring details of 94 characteristics (dimensions) across 31 key components of public financial management (indicators) in 7 broad areas of activity (pillars). At a glance, the user cannot understand a country’s region’s performance.
- At the end of the assessment, PEFA’s website provides a detailed report, usually several hundred pages long.
User Research
User Types
What are the user types? We categorized PEFA’s users in two groups and conducted user interviews remotely with 6 users from different countries.
- World Bank's Internal Staff (who use PEFA's assessments for their projects with local organizations)
- Government Counterpart & Funder Representative (who use PEFA's assessments for various estimate and convince stake holders to make decisions)
Insights
1. What do you use the website for?
a) Evaluation purposes
b) Information purposes
c) Carrying out the reforms
"We use the PEFA assessment to understand the financial management."
“If we need information to build a dialogue on the reforms we want to see the past reports for that country."
"...Communicating to donors. And we need to gain support from the government.”
"Track the development and the reforms . When the government uses PEFA it’s good to show the progress after the assessment.”
2. What is your current workflow when you use PEFA?
a) Start from a country level
b) Download the reports
c) Look for Scores of each key component
“I often go to see other countries on the same level of development of facing the same challenges.”
“Once in a while when there are updates or when I want to learn about a country, I'll go to PEFA.”
“I downloaded the reports because we don’t have internet connection to the website all the time when we're traveling in some countries.”
“If the scores are available online that would be useful.”
Information Architecture
High Level
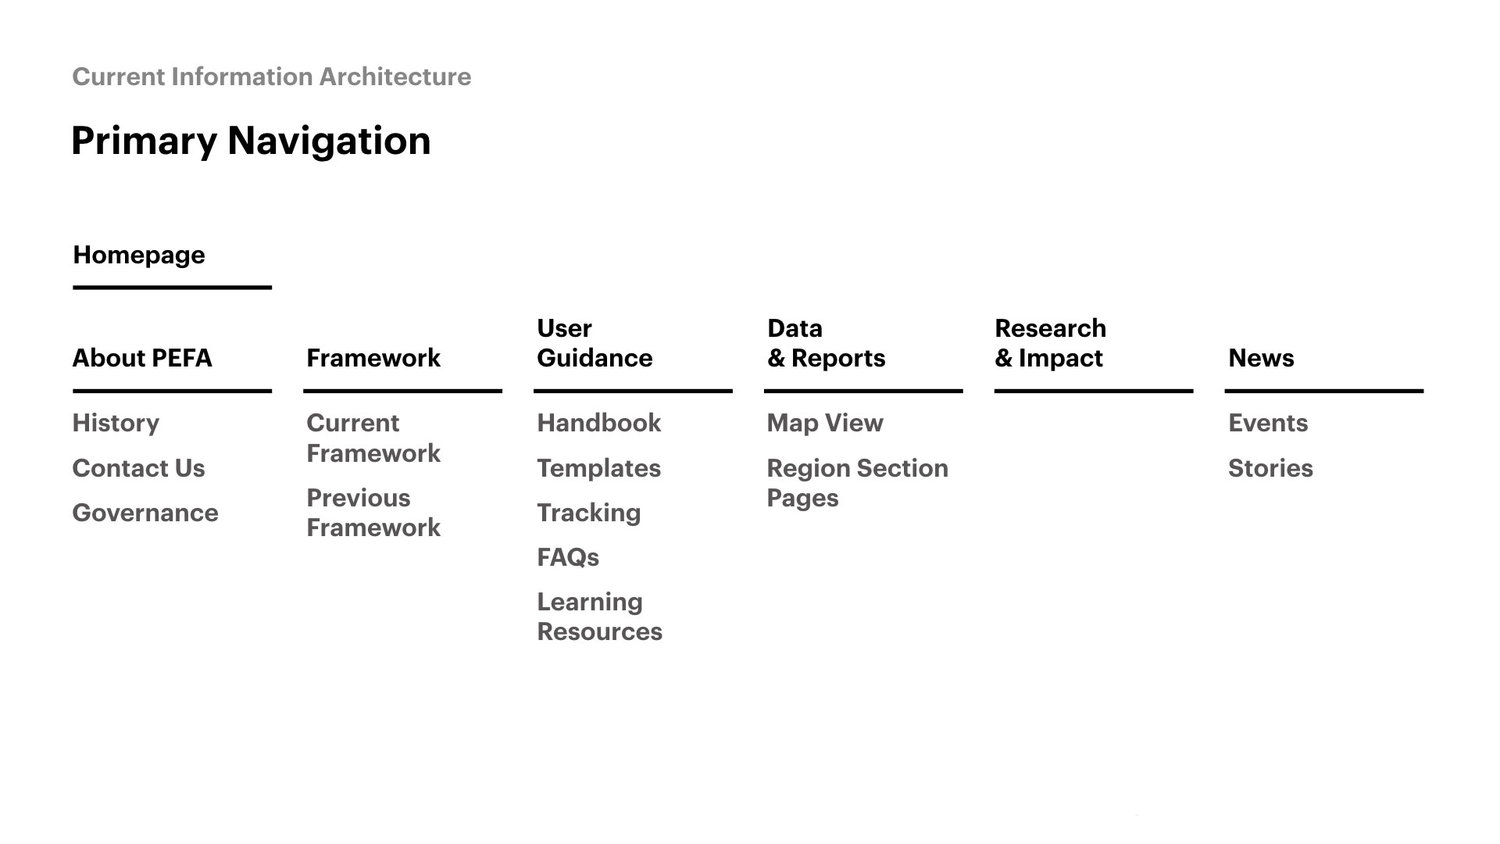
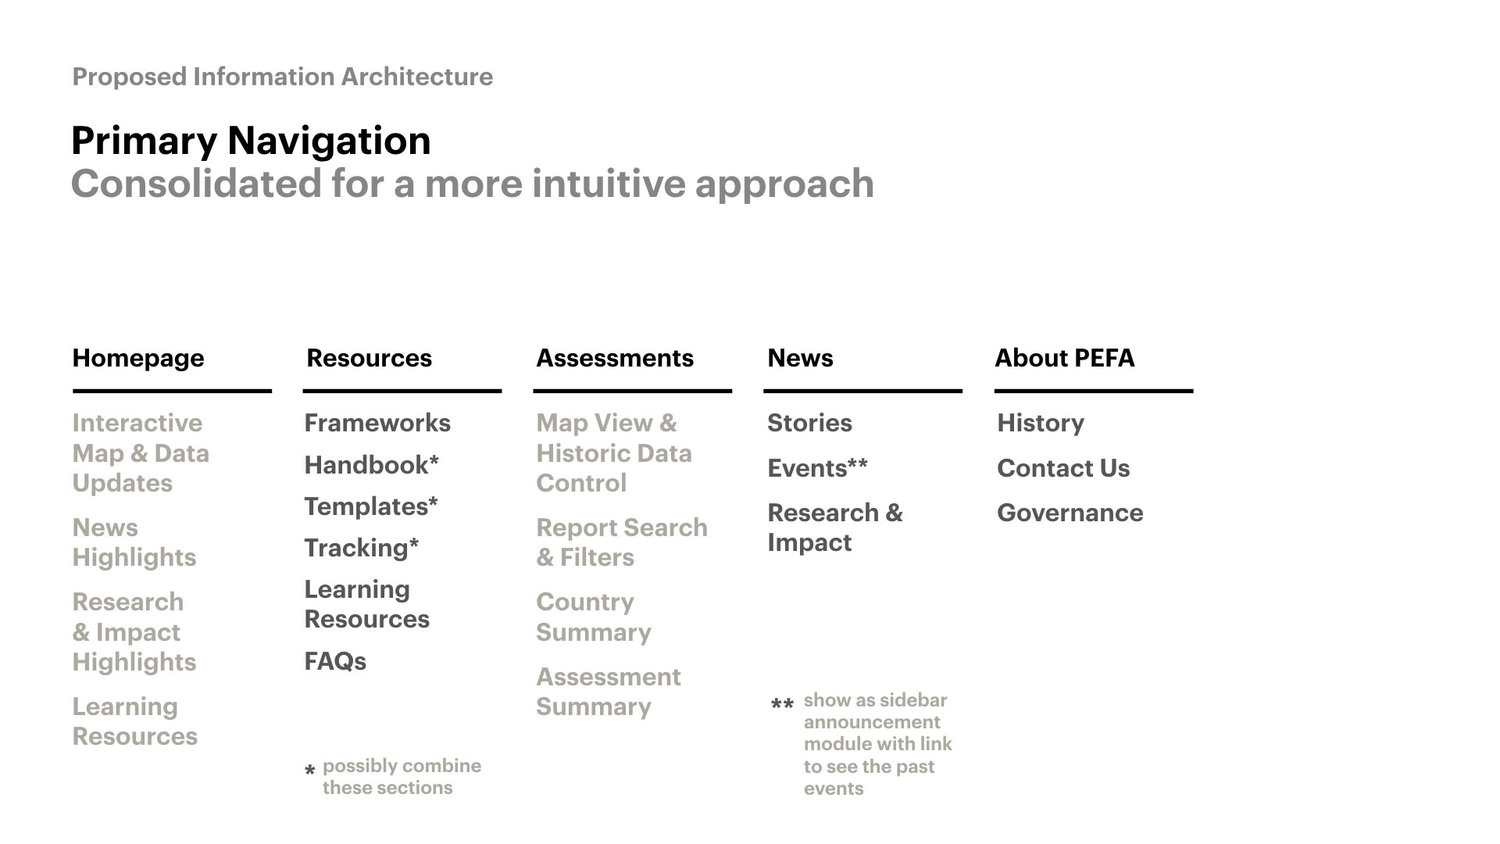
We did a thorough content audit of PEFA's website, and proposed new information architecture.
Interaction Model
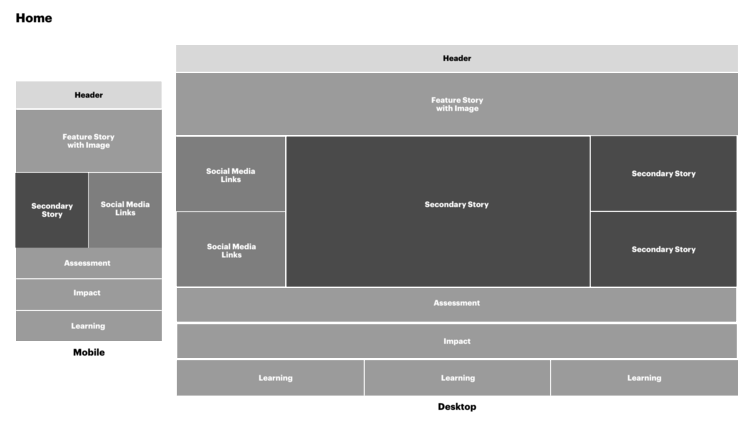
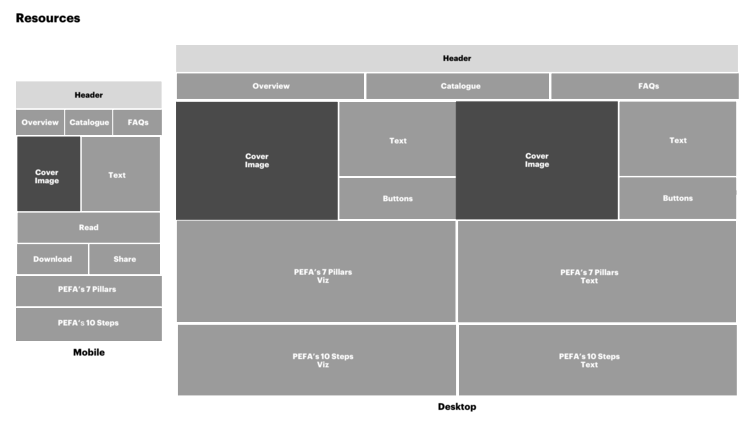
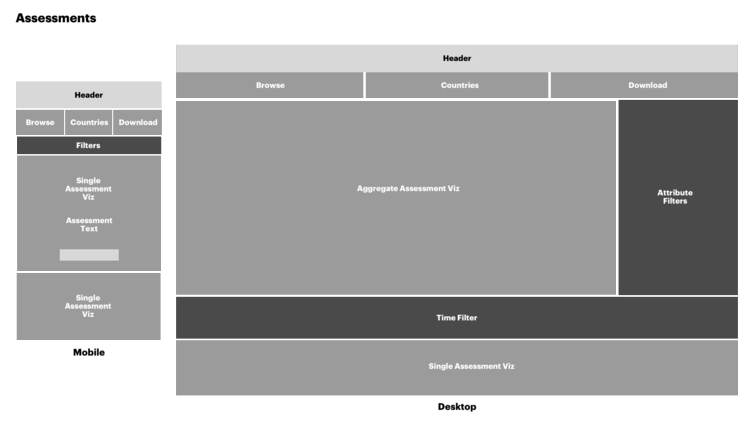
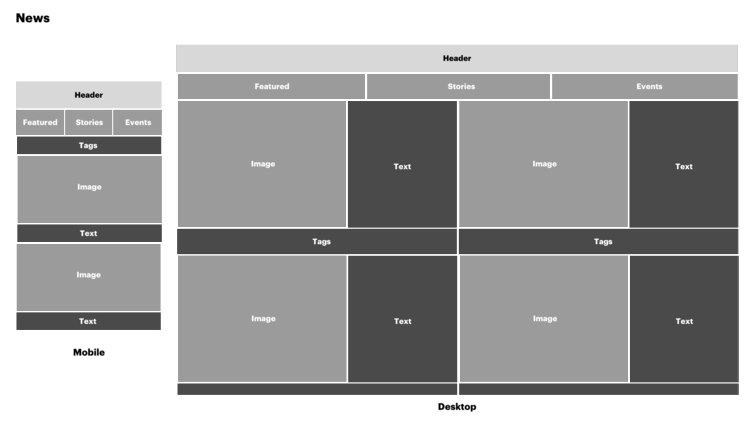
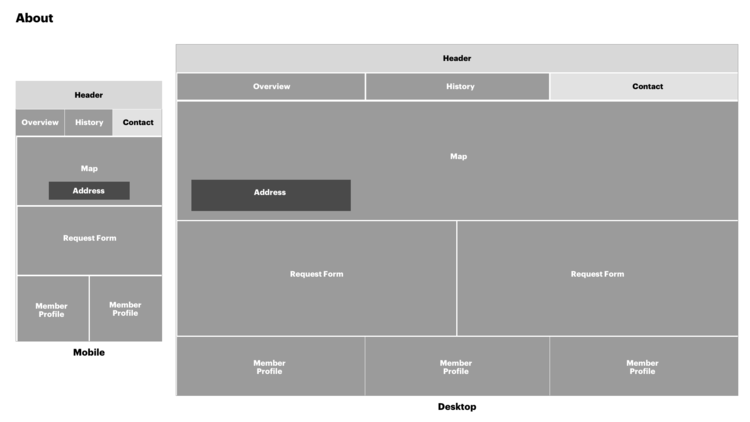
It was pretty straightforward to design a desktop experience, yet since PEFA asked for a mobile version as well, I proposed to think about the mobile layout first, aka Mobile-first Design. The reason to take this path rather than graceful degradation was mainly because in PEFA’s case, the essential “hero“ experience is to help users quickly understand and compare each country’s performance. Since data visualization is the essential piece to tell the stories, I asked my teammates to consider the mobile screen size while designing the chart for PEFA. In one word, there’s no reason the downgrade the user experience on mobile screens. I sketched skeleton of Mobile and Desktop layout:
Data Visualization
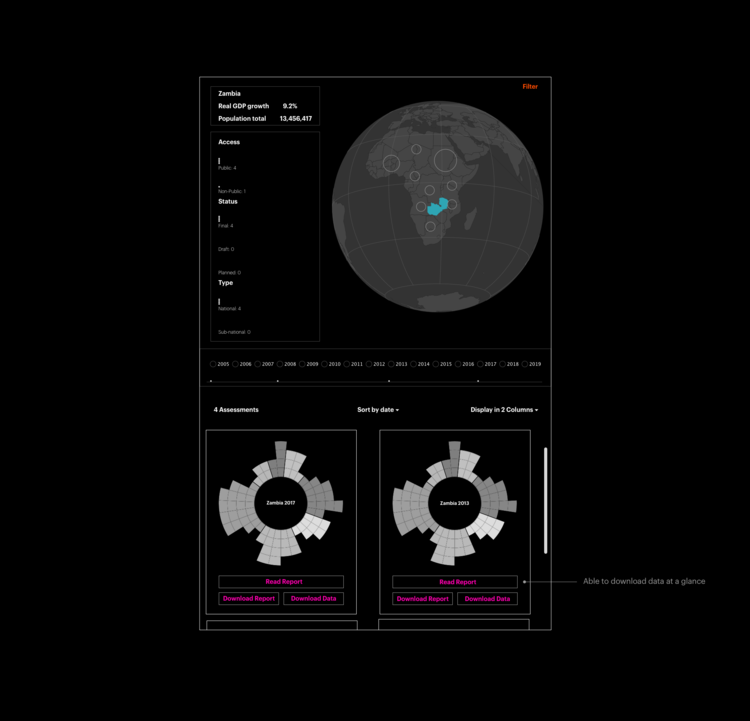
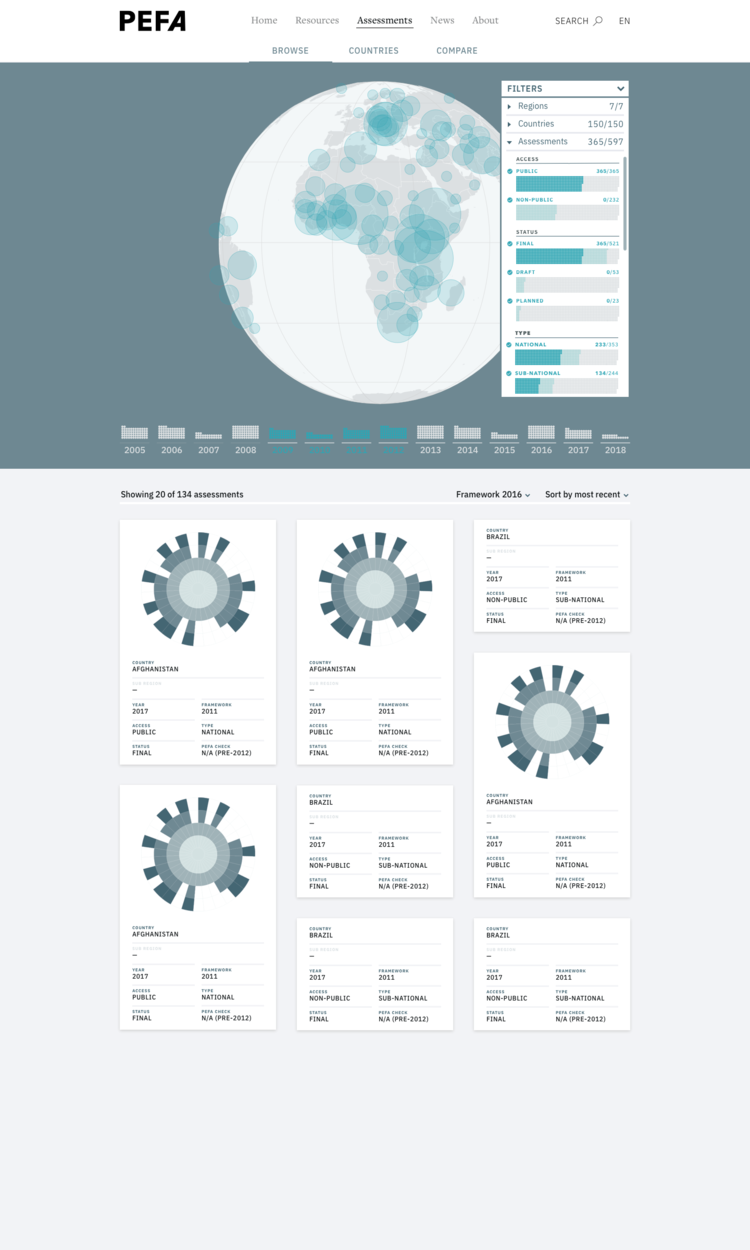
The biggest challenge of PEFA website is to design a data visualization form that represent each country’s assessment report. I proposed the initial structure of Assessment Page and data viz solution, and iterated the design under the guidance of the creative director.
Lofi Assessment Page
Midfi Assessment Page
Hi-fi Assessment Page - the visual designers refined the data viz and selected a color palette. Implemented here
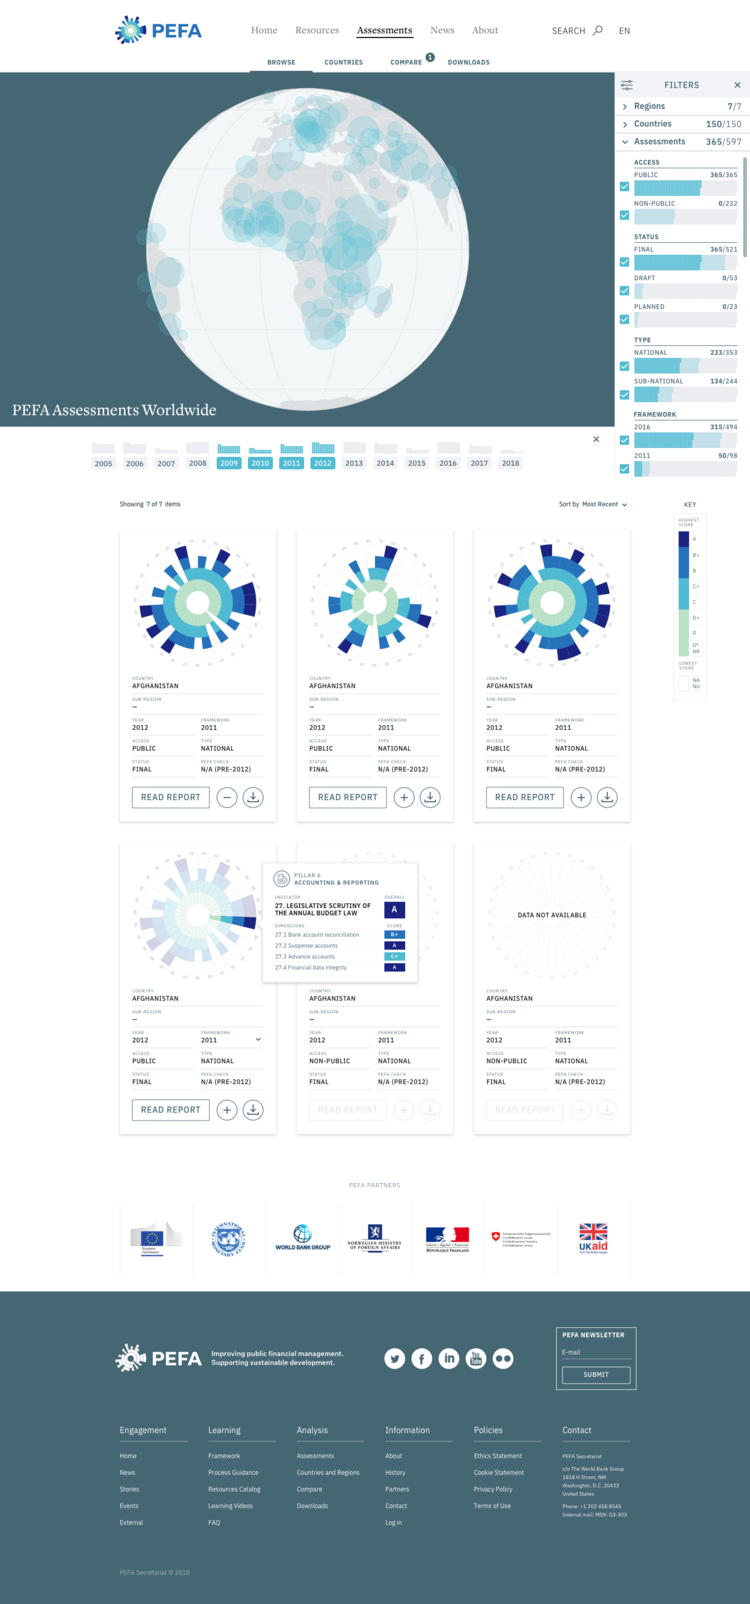
Final Hi-fi Design
I made this video for the mobile design using Invision.