Envisioning video aligned product, marketing & engineering leadership · Guided onboarding replaced manual setup · GA with 100+ customer pilots
My role
I took the product from an engineering accelerator to a designed experience and became the primary UX designer for the Fabric workload. My work covered the envisioning story, the end-to-end onboarding and management UX, alignment with Fabric design patterns as a designer coming from Azure, usability iteration before engineering, and implementation fit-and-finish.
The problem
Business Process Solutions (BPS) began as an accelerator: SAP data models, extraction and transformation pipelines, and Power BI templates. The technology worked, but setting it up required deep knowledge of S/4HANA CDS views, lakehouse layers, configuration metadata, pipelines, and notebooks. Enterprise data was spread across systems, and SAP data was especially hard to extract with its business meaning intact.
Design challenge: How might we turn that accelerator into a native Fabric workload that hides unnecessary setup complexity without taking away the flexibility enterprise data teams need, and scale it from SAP to Salesforce and beyond?
The solution
Business Process Solutions is a prebuilt Fabric workload that helps organizations gain strategic insights and optimize operations using information from applications such as SAP and Salesforce. It simplifies integration with Microsoft Fabric through prebuilt, ready-to-deploy resources that accelerate data extraction, transformation and analytics. Predefined models for key functional areas, including Finance, Sales, Procurement, Manufacturing, Financial Planning and Inventory, provide comprehensive business semantics that form the foundation for Fabric IQ and data agents. This approach helps customers reduce deployment effort and costs while lowering project risk. It also serves as the data foundation for their future AI deployments against operational business data.
Users
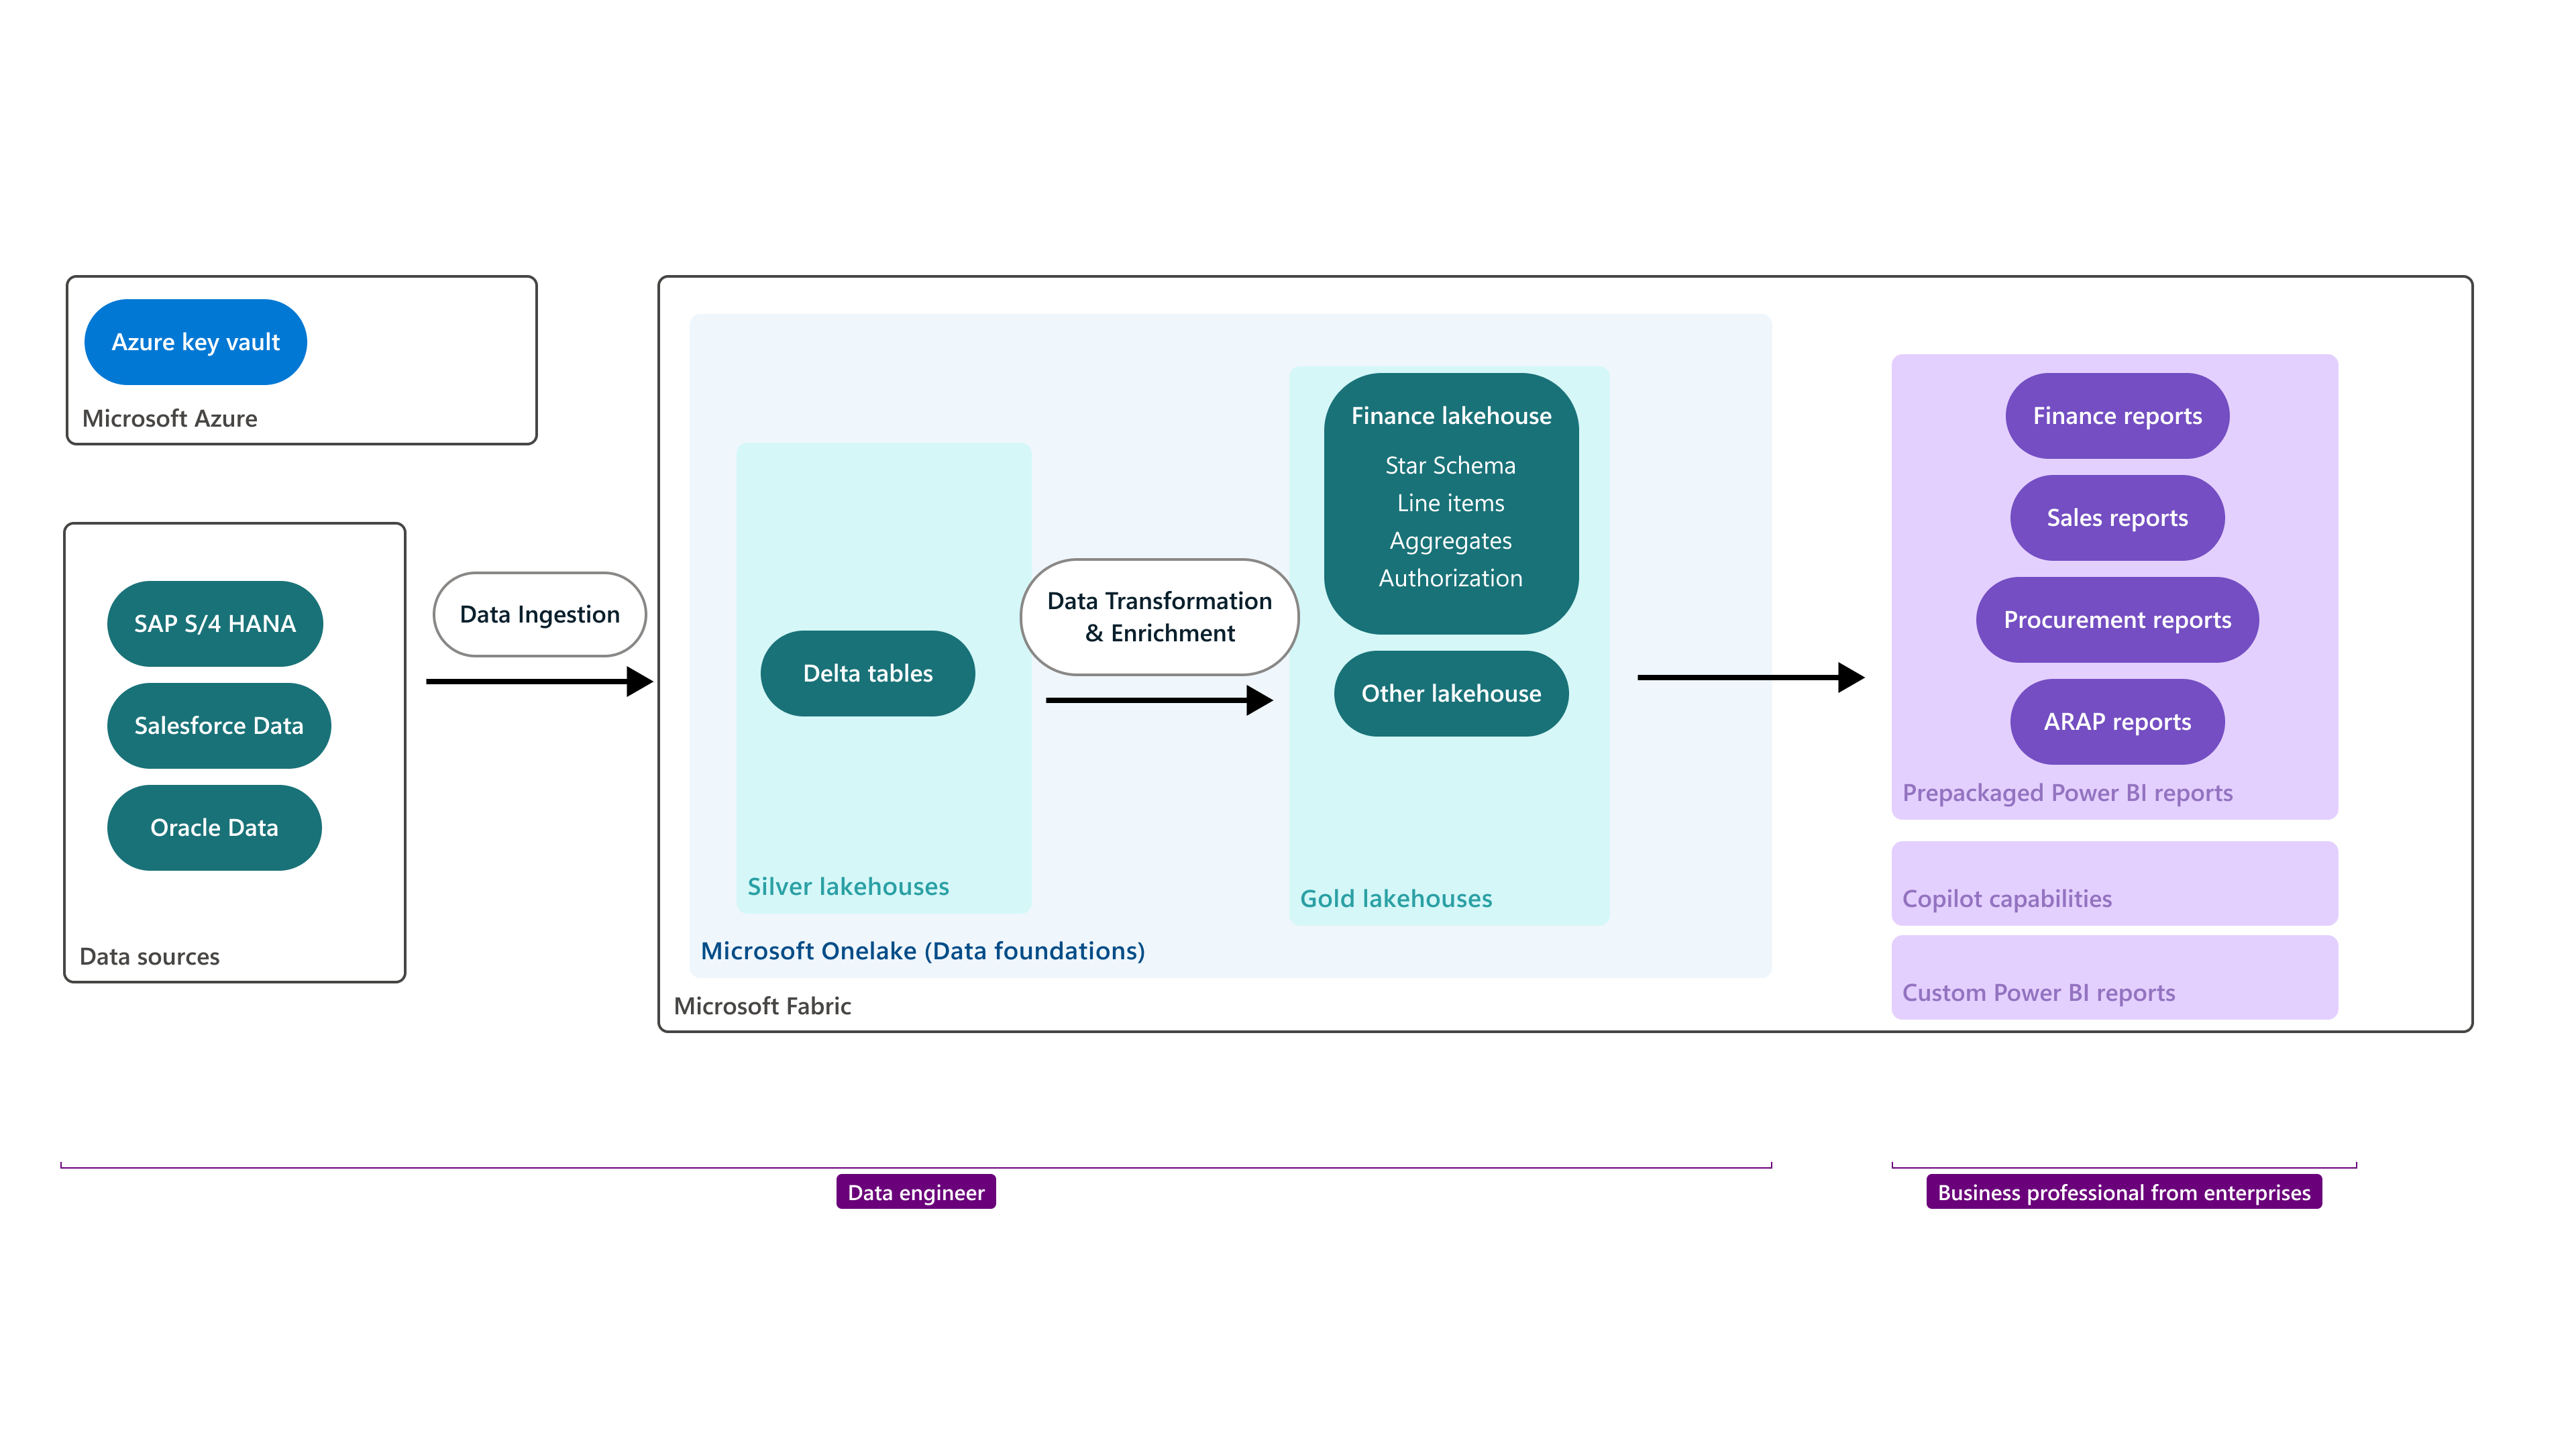
Data engineer: Connects source systems such as SAP S/4HANA, Salesforce, and Oracle; ingests and transforms data through Silver and Gold lakehouses; and prepares trusted, business-ready models.
Business professional: Finance, sales, and procurement users who turn that data foundation into reports, dashboards, and insights, with Copilot capabilities supporting analysis.
BPS structure: data engineers create a trusted Fabric foundation for business professionals’ reports and insights
These roles are connected: data engineers prepare trusted business data, while business professionals use the resulting reports and insights to make decisions. Research surfaced a key tension. Less experienced users loved the guided, template-based approach, while seasoned enterprise practitioners questioned whether it would hold up in heavily customized production environments.
Design process & iterations
Iteration 1: Envisioning video: from architecture pitch to user story
Before: The first cut opened with about 44 seconds of architecture and marketing framing before showing the experience. Stakeholders asked for an additional product slide and for the internal codename to appear as a UI object.
What we learned: Too much conceptual setup buried the experience, and showing internal architecture literally would confuse the product’s meaning for users.
After: I pushed back and kept the story persona-led: a data professional sets up data → a business user reads dashboards → the business user acts through Copilot and agents. The business-user moment moved into Teams so they didn’t have to switch to Power BI, putting the ideal journey ahead of current feasibility. I also produced a shorter cut.
Why it matters: The video aligned Product, Marketing, and Engineering leadership on the vision and became foundational input for later research.
Business Process Solutions envisioning video: from architecture pitch to user story
Iteration 2: Connect the source to the insight
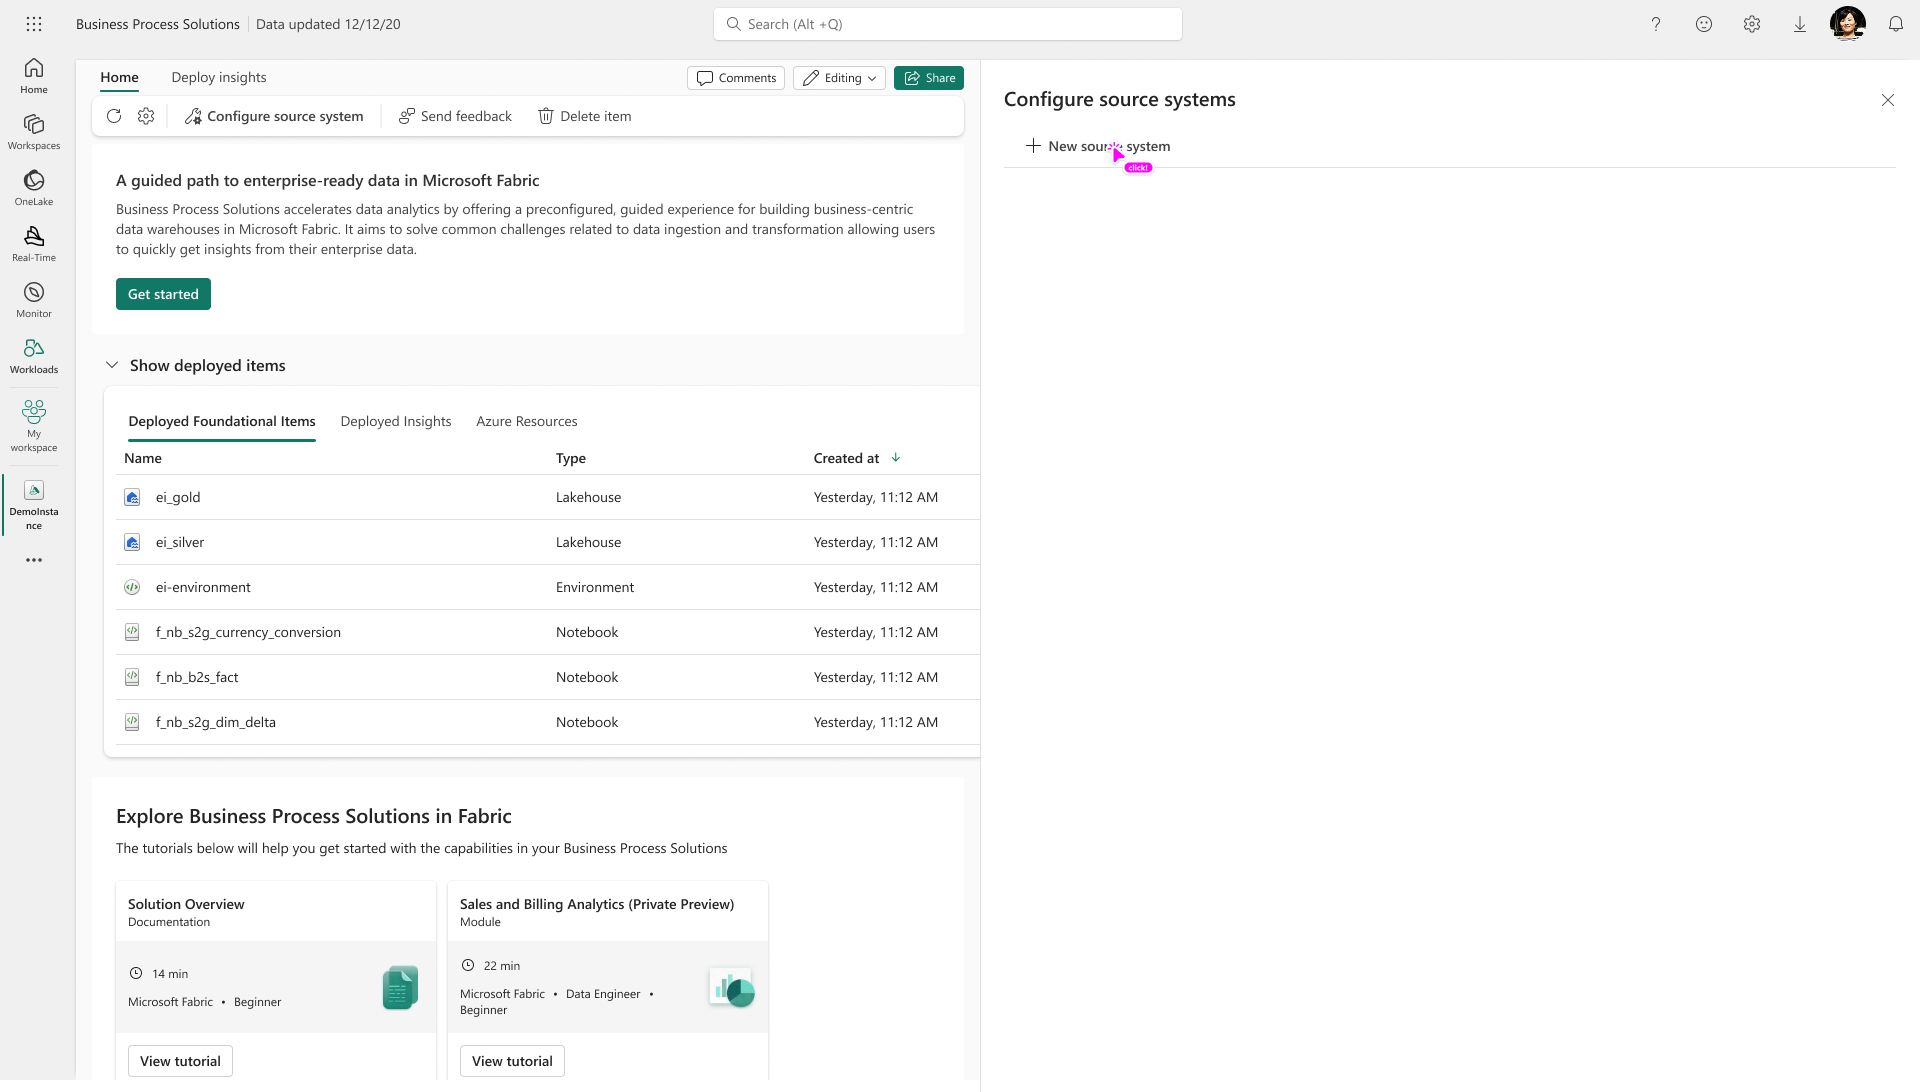
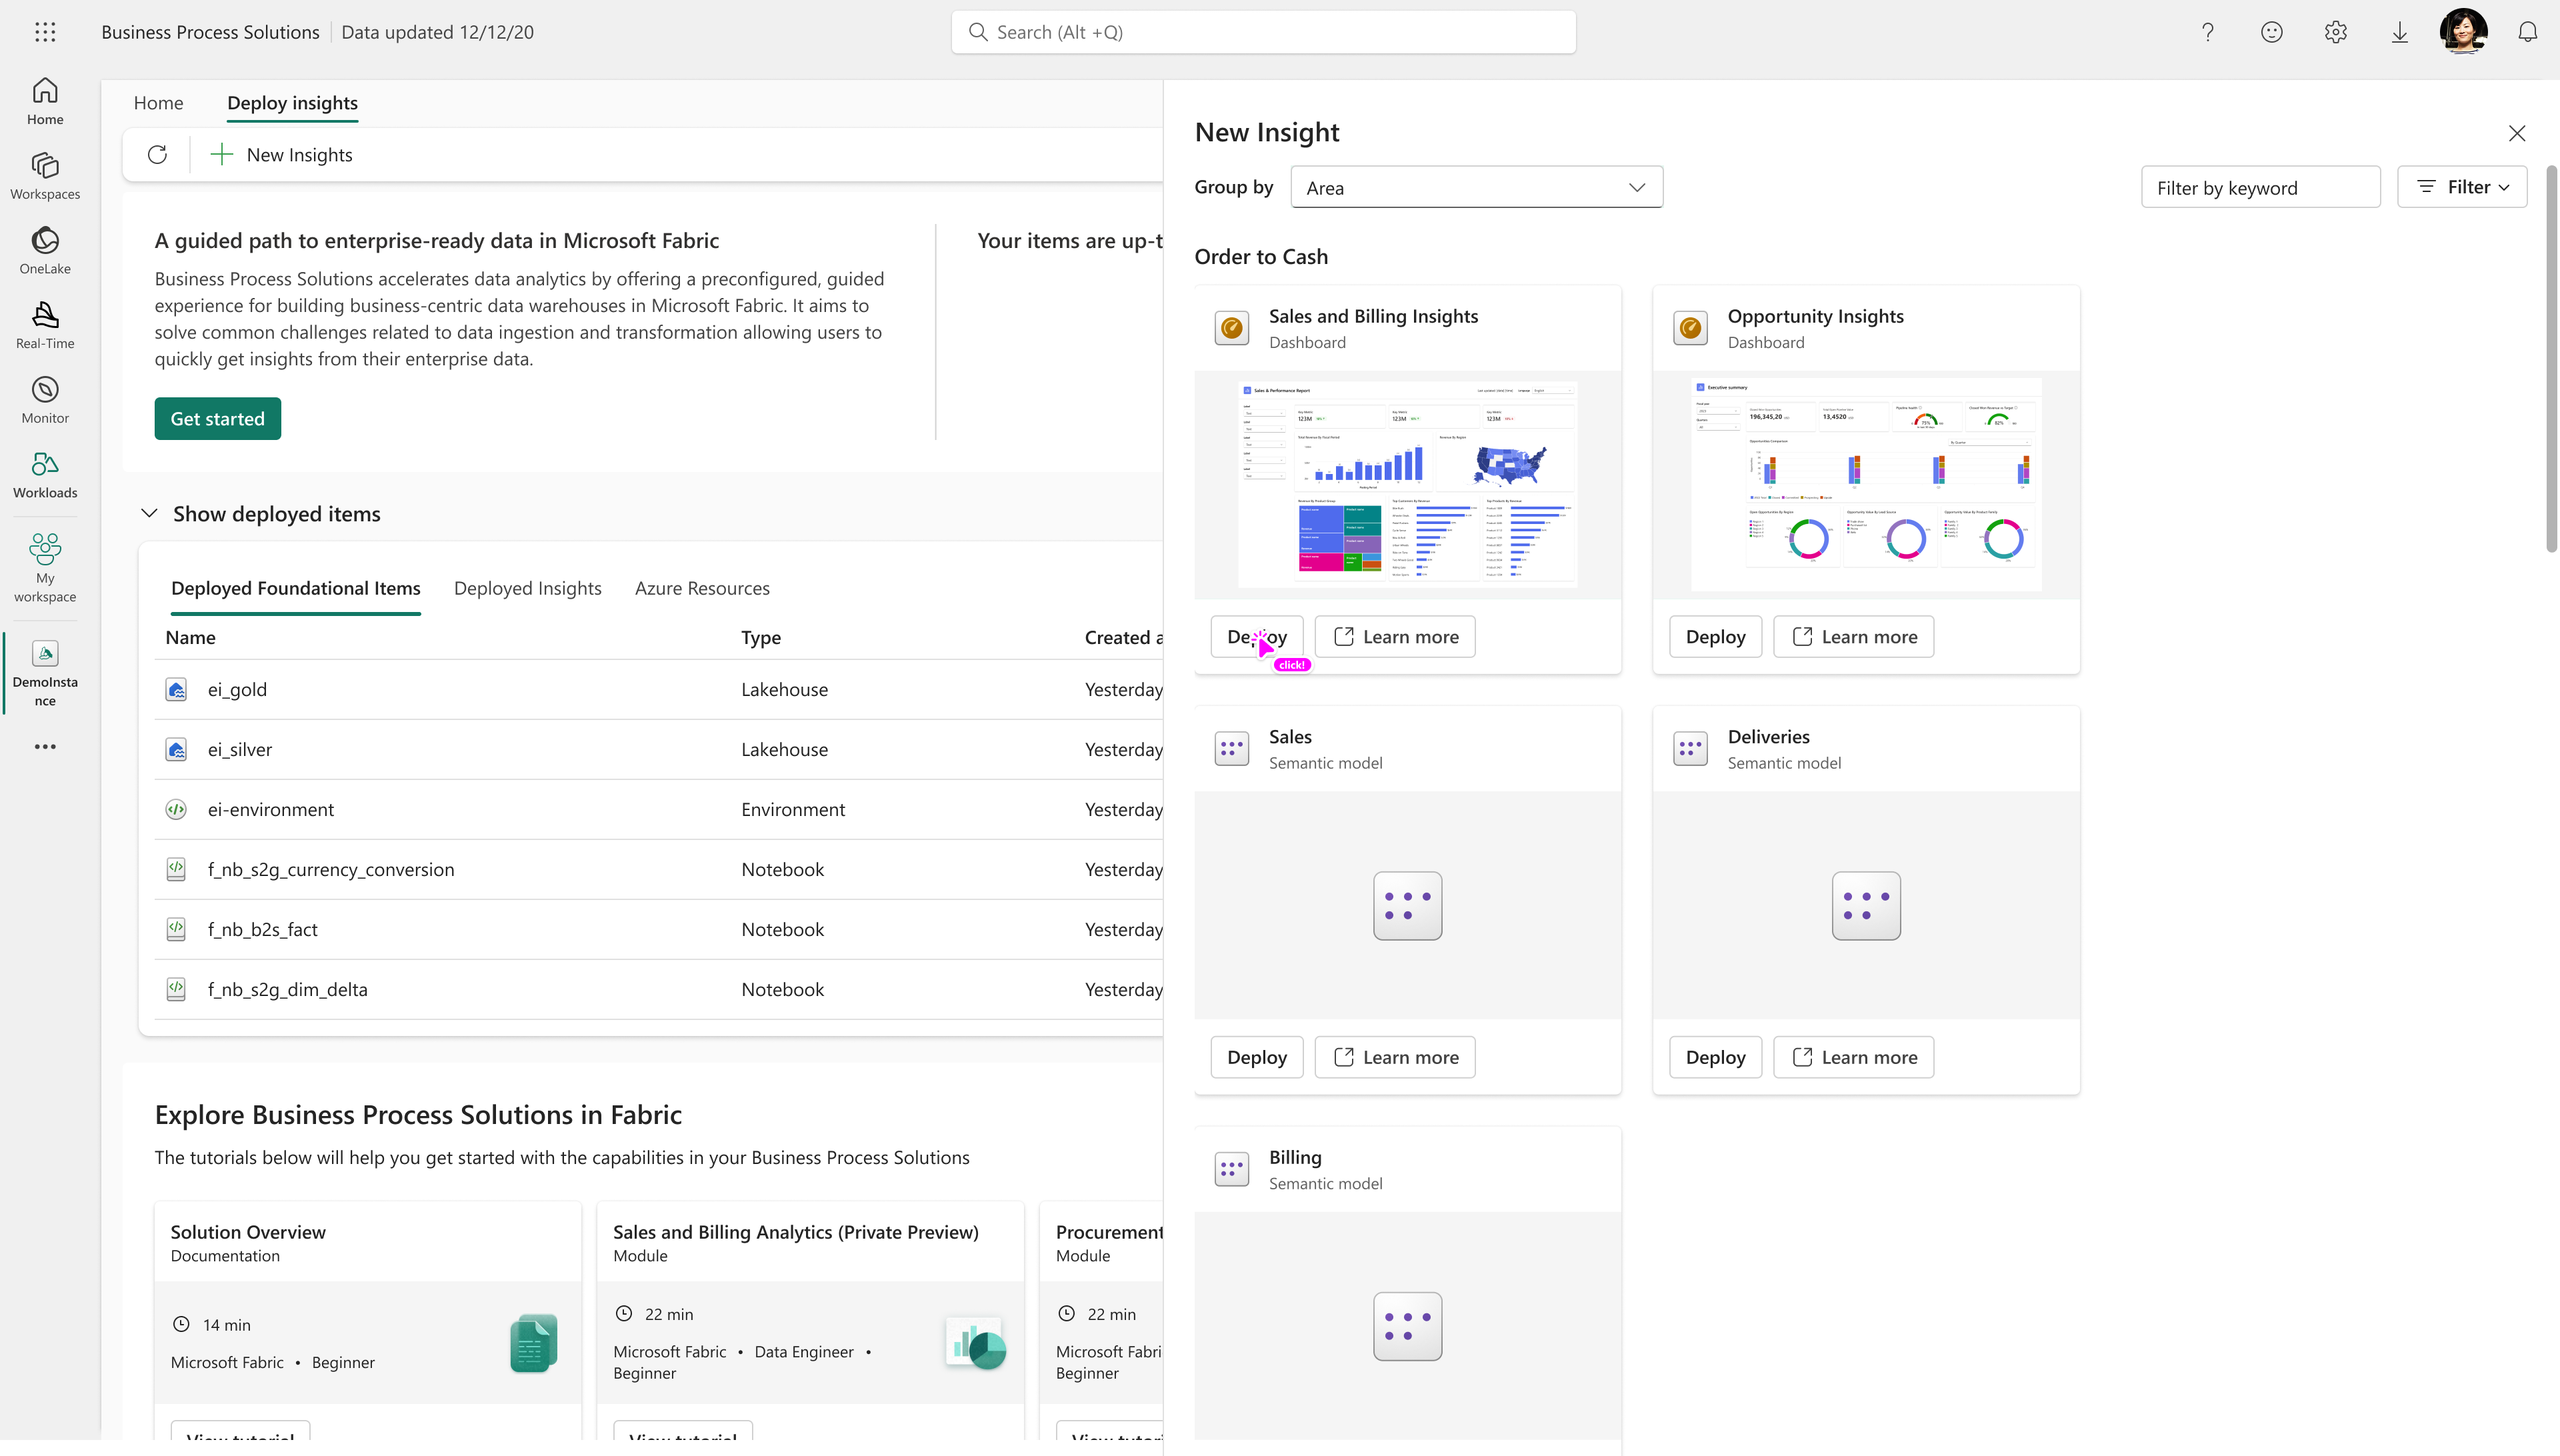
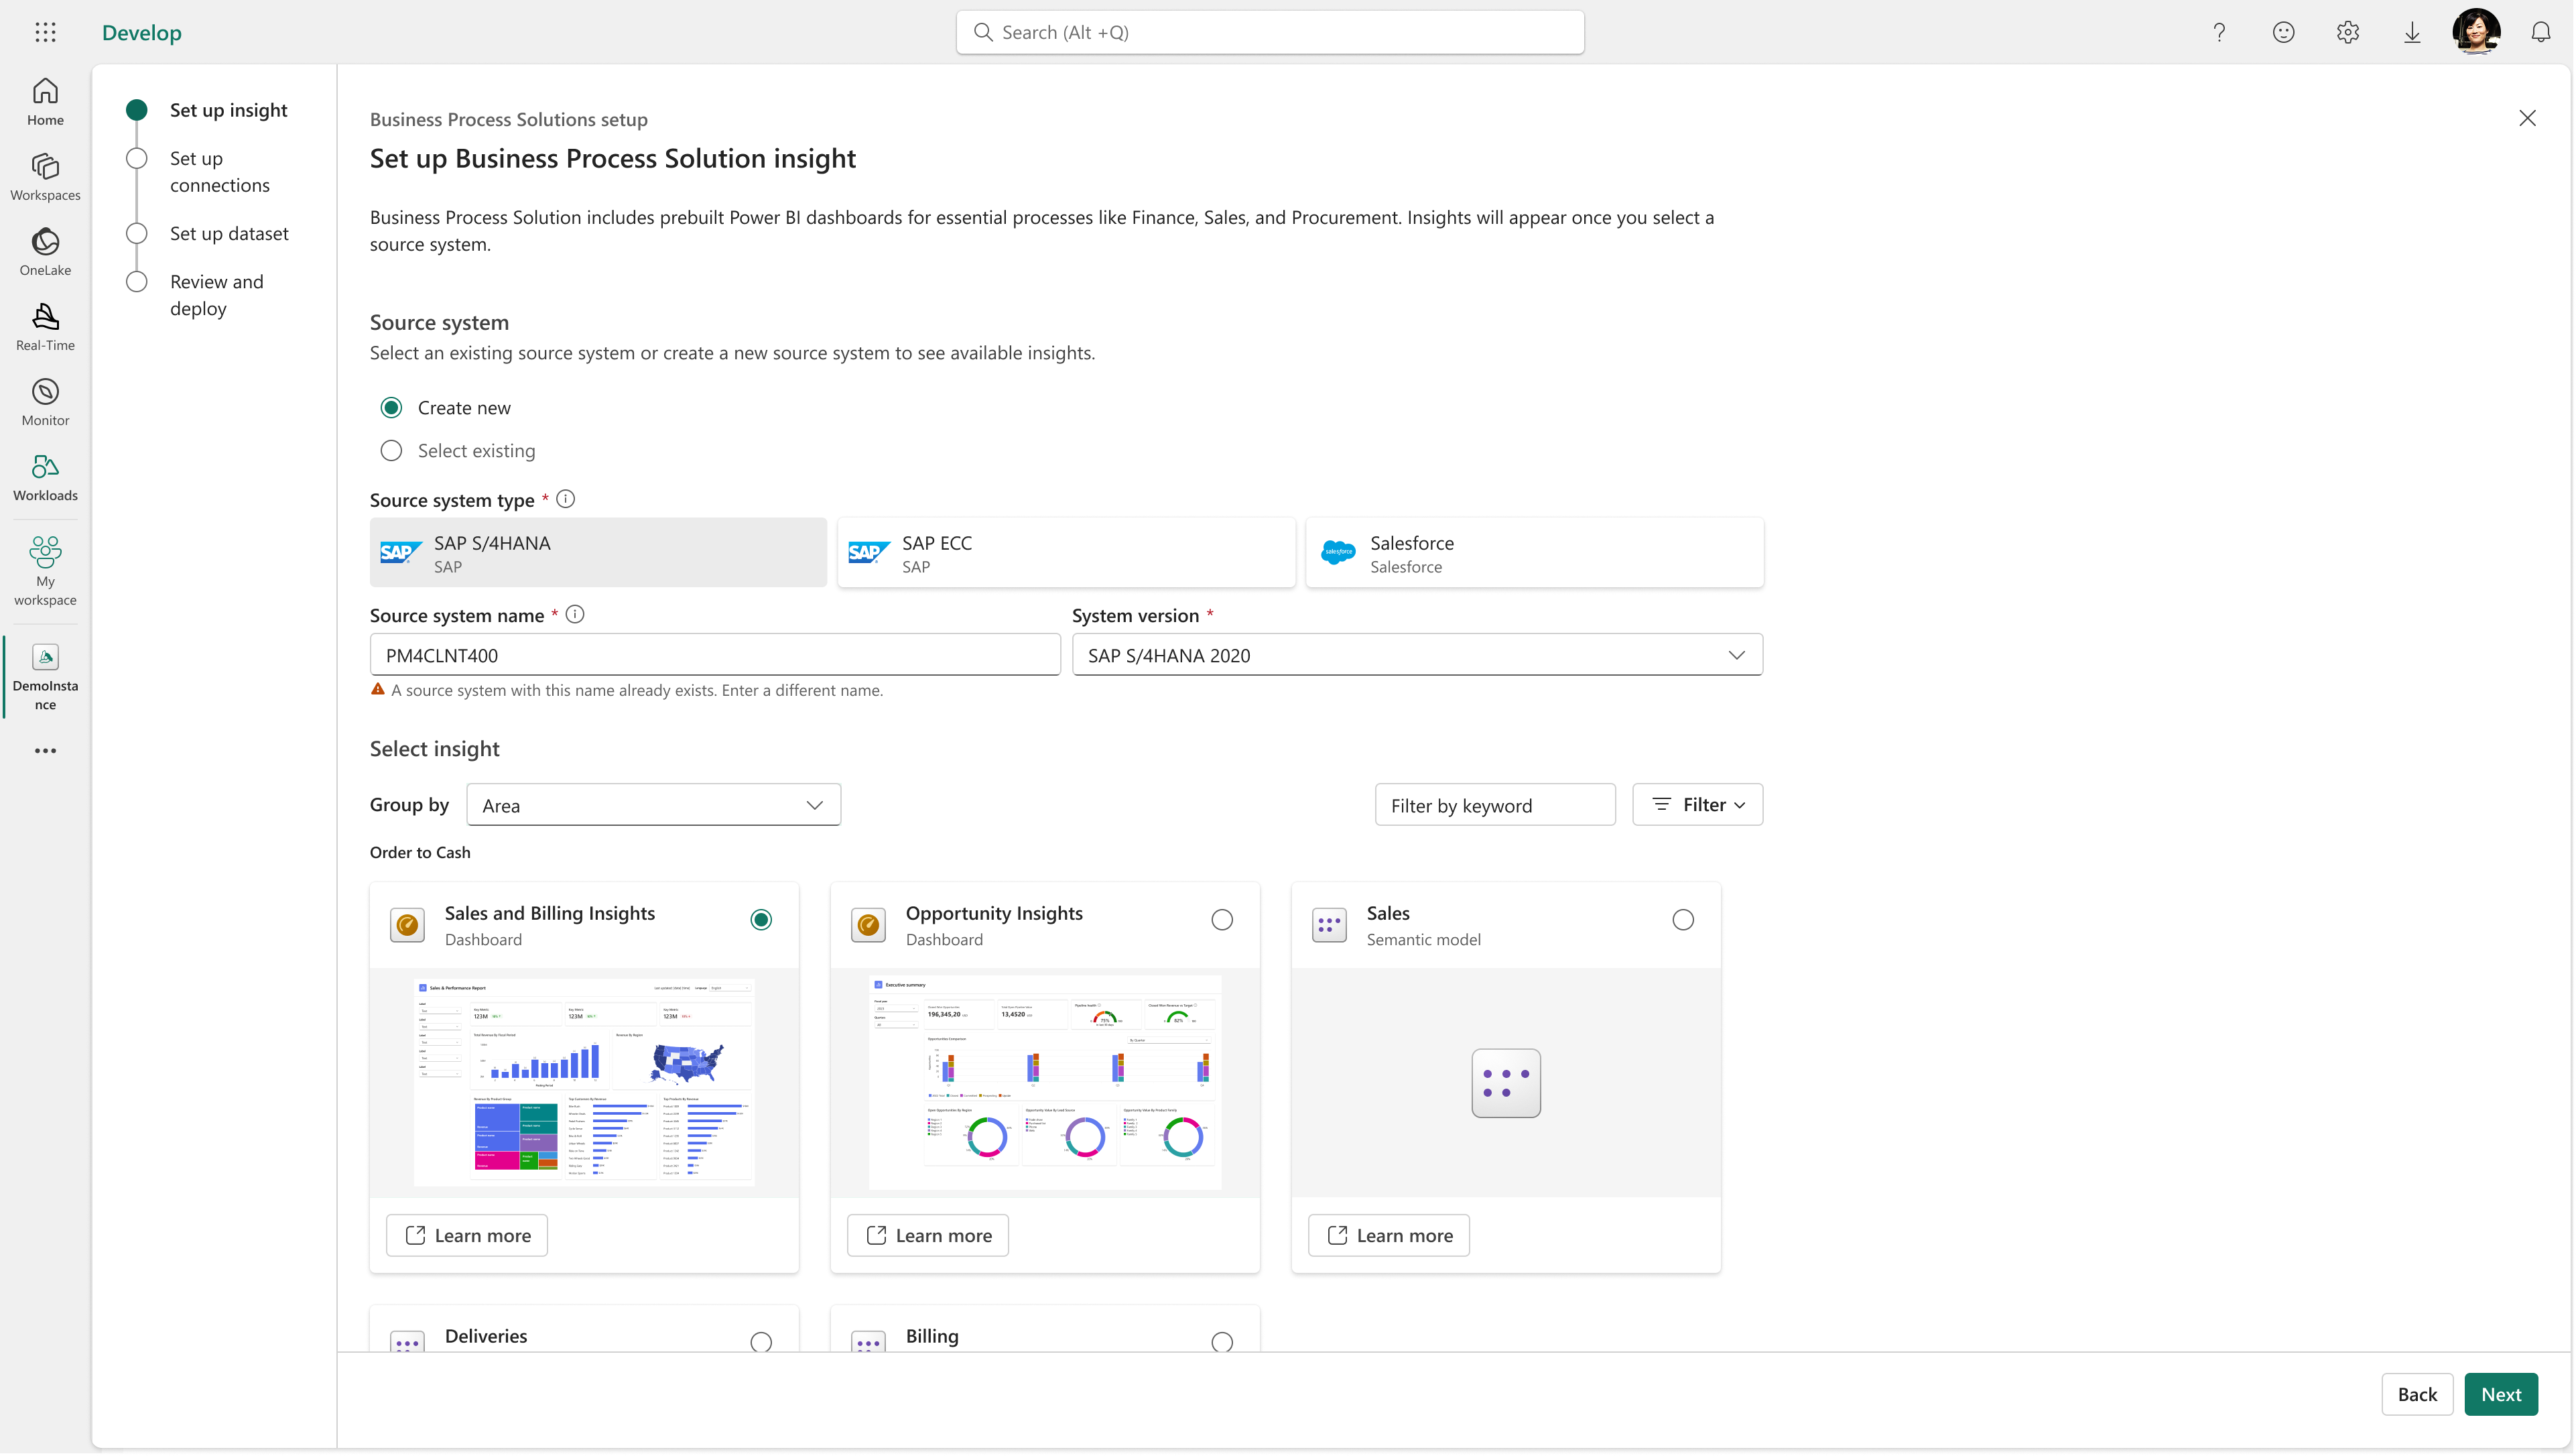
Before: Configuring a source system and choosing an insight dashboard were two independent flows in BPS. Neither flow made it clear that the user’s goal was to create an insight from their business data.
Before: configure a source system in a separate flowBefore: choose an insight dashboard in a separate flow
What we learned: Source setup and insight selection are not separate user goals; they are connected steps toward creating an insight. The experience needed to make that outcome and the required path to it visible.
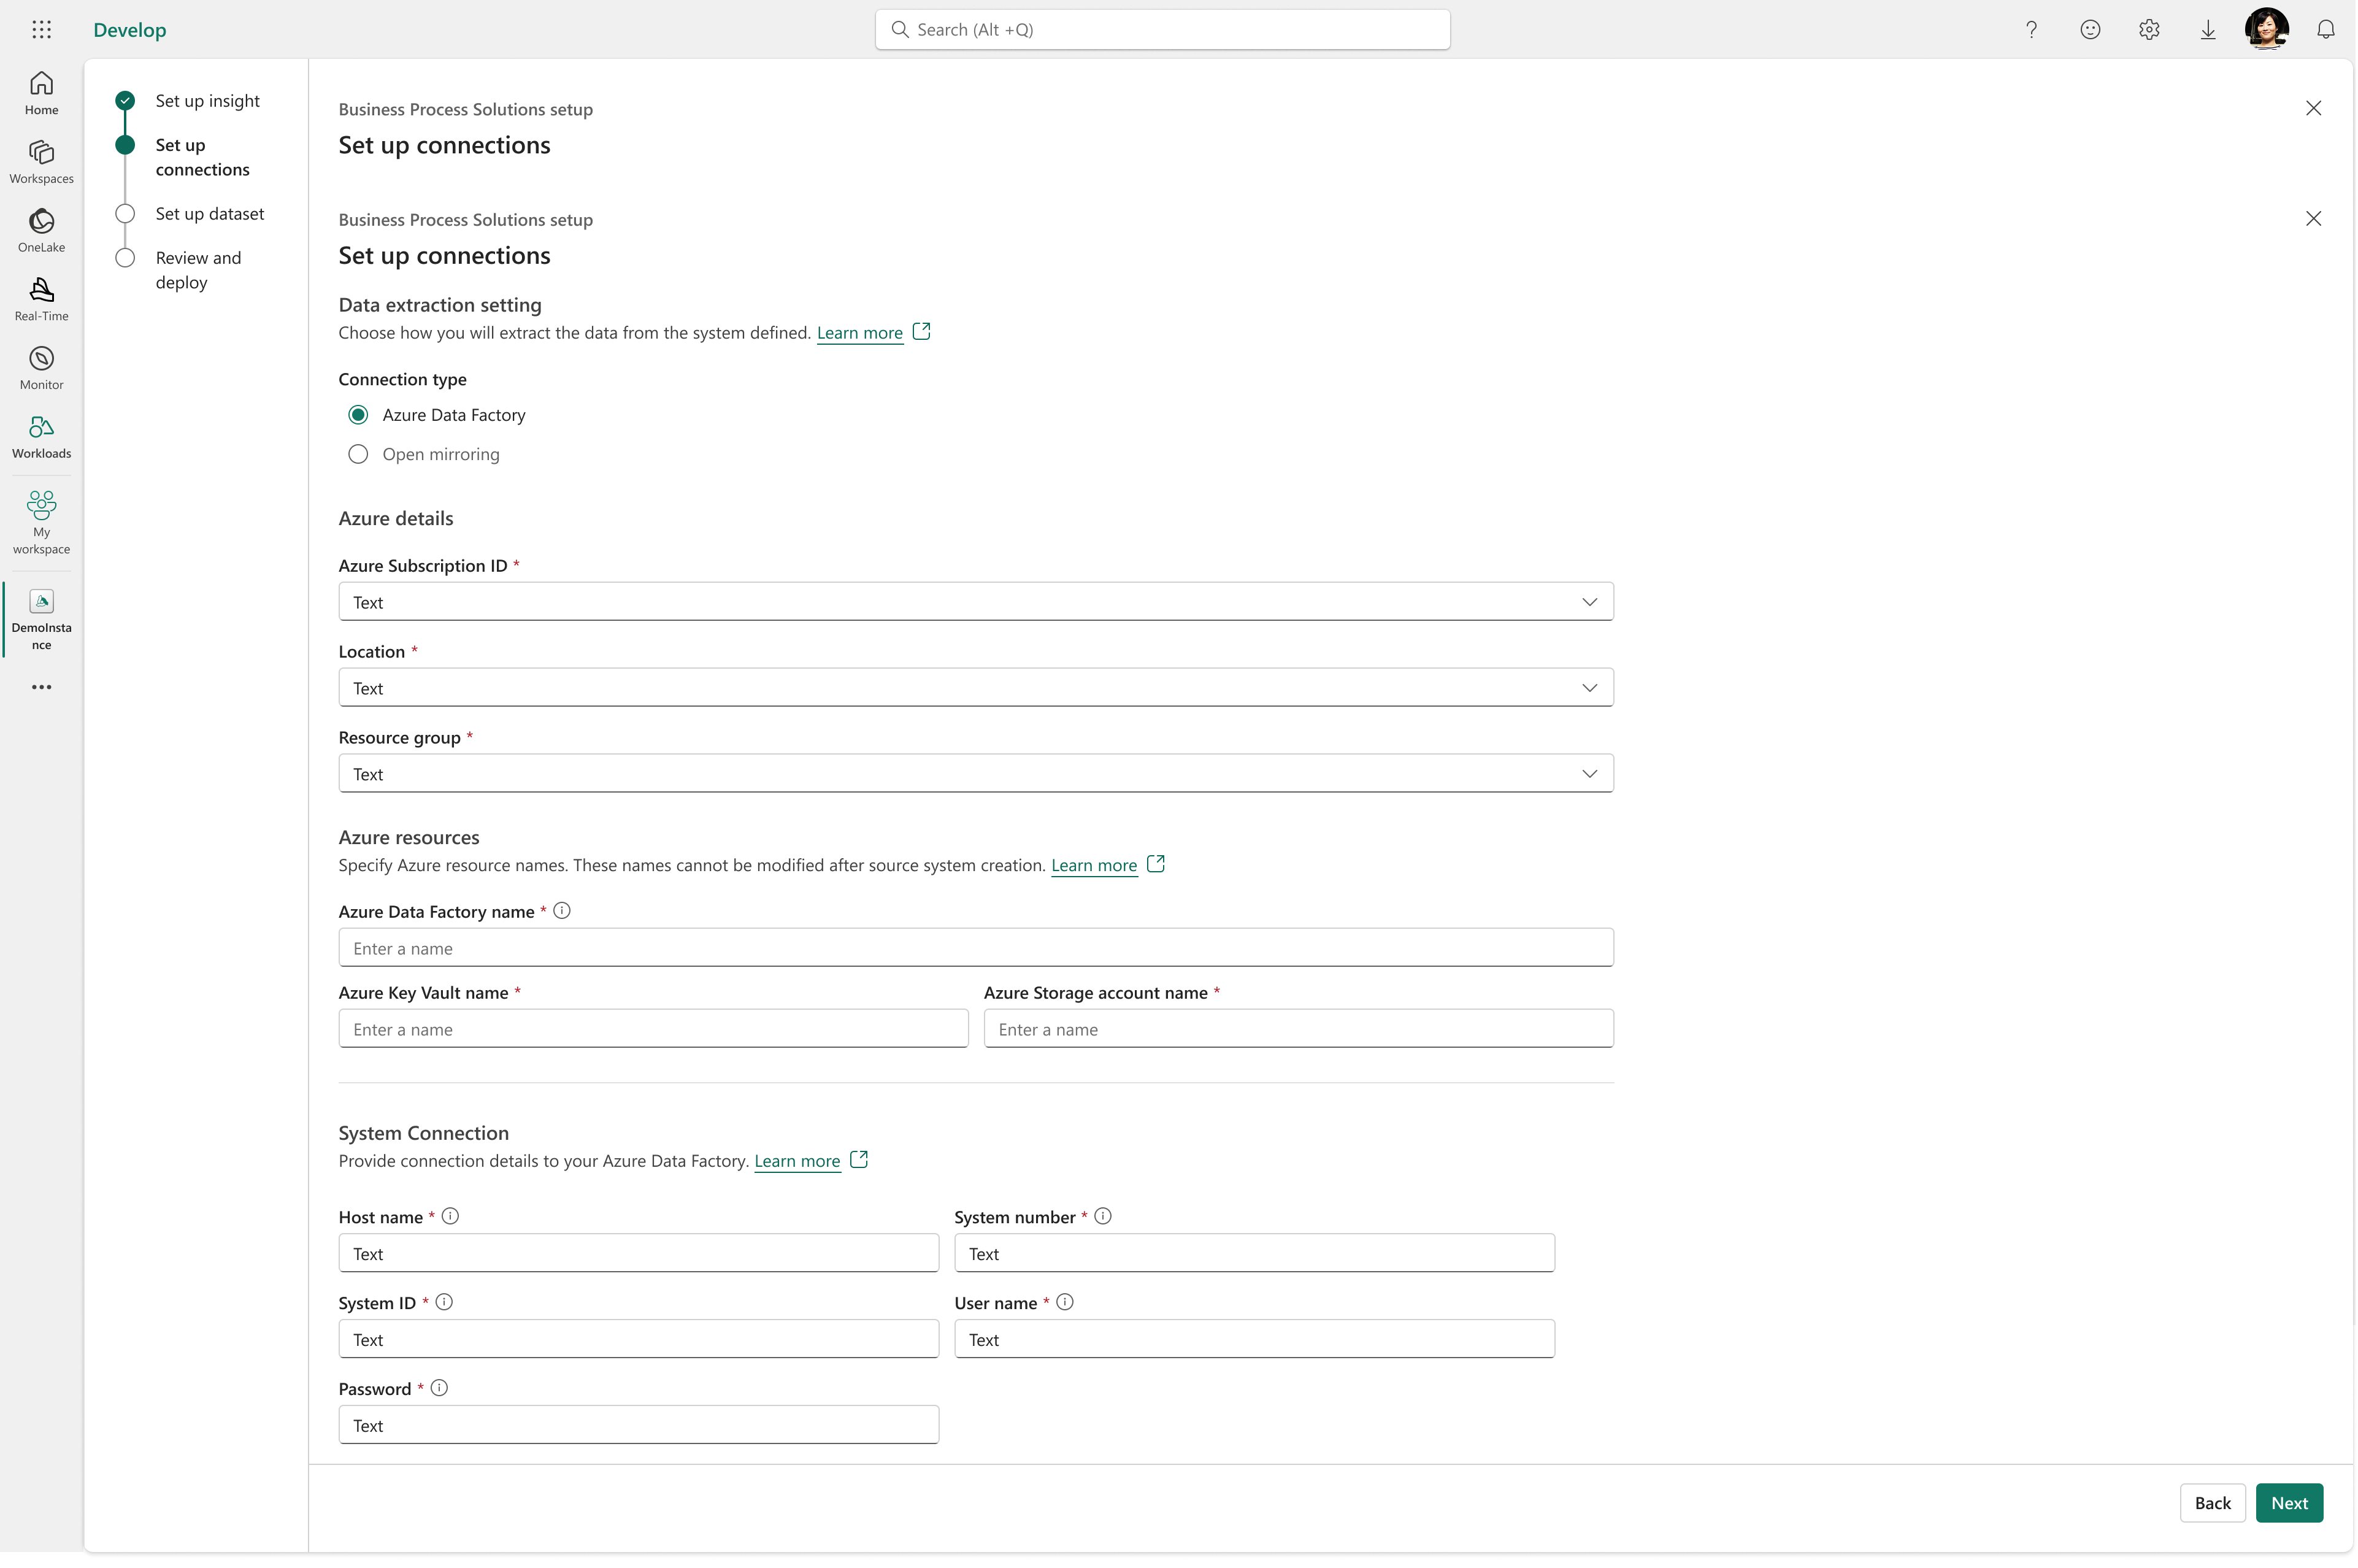
After: We combined source-system configuration and insight selection with the other required setup steps in one guided flow to create an insight. The user can see the essential object they are creating and understand how each step—connecting a source, choosing an insight, setting up data, and reviewing the deployment—contributes to that goal.
After: start by setting up an insight and selecting its source systemAfter: configure source connections as a step toward creating the insight
Why it matters: The workflow makes the insight—not an isolated source-system configuration or dashboard—the essential object and user goal.
Iteration 3: Dataset & table management: removing system jargon
Before: Datasets were grouped only by source system and showed a generic “Healthy” status. Imported tables had to be explicitly “Enabled.” Key columns were configured manually.
What we learned: Users asked, “Healthy in what sense? When did it last refresh?” They couldn’t tell what “Enable” meant (visible? permissioned? in the semantic model?) and saw manual key-column setup as a risky source of errors.
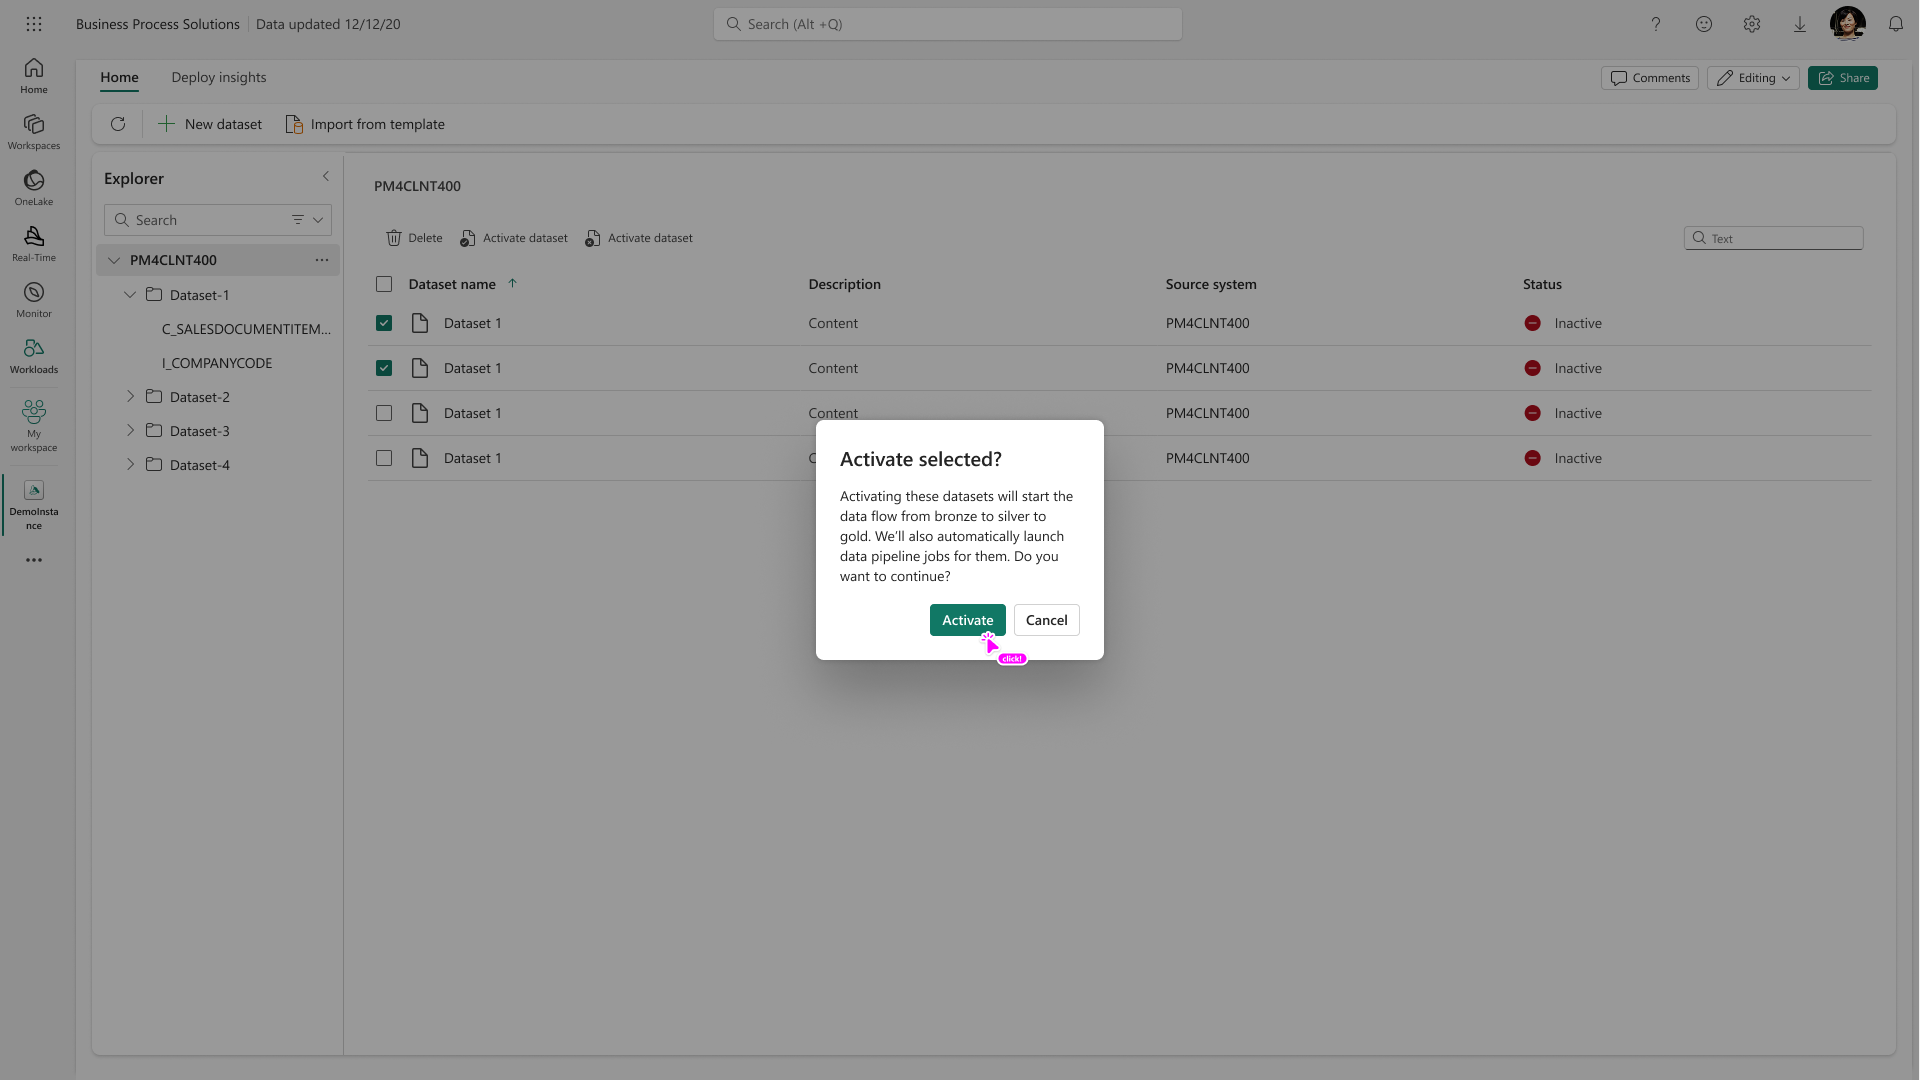
After: Datasets can be organized by business domain, master vs. non-master data, and custom vs. template; status shows the last refresh and refresh frequency. Tables are enabled by default, with key-column metadata imported from SAP wherever possible. When users select datasets to activate, an explicit confirmation dialog explains what activation will do: start the data flow from bronze to silver to gold and automatically launch the data pipeline jobs. The dialog asks users to confirm before proceeding, clarifying the meaning and impact of activation.
Why it matters: Don’t make users perform a system step that’s almost always required. Automate the brittle parts and keep control where it matters.
Iteration 3: an explicit confirmation explains what activating selected datasets will do
Iteration 4: Make available updates easy to find
Before: Update actions were scattered across the list, attached to their corresponding items. Users had to scan the column to find which items needed updates.
What we learned: Item-by-item actions made update availability hard to discover. Users needed a clear, centralized signal and a way to review every item with an available update.
After: When updates are available, a top banner surfaces them together. Selecting the banner opens a side panel with the full list of items that have updates available, so users can review them in one place.
Why it matters: Users can see when updates need attention without hunting through individual rows, then review the affected items from a single entry point.
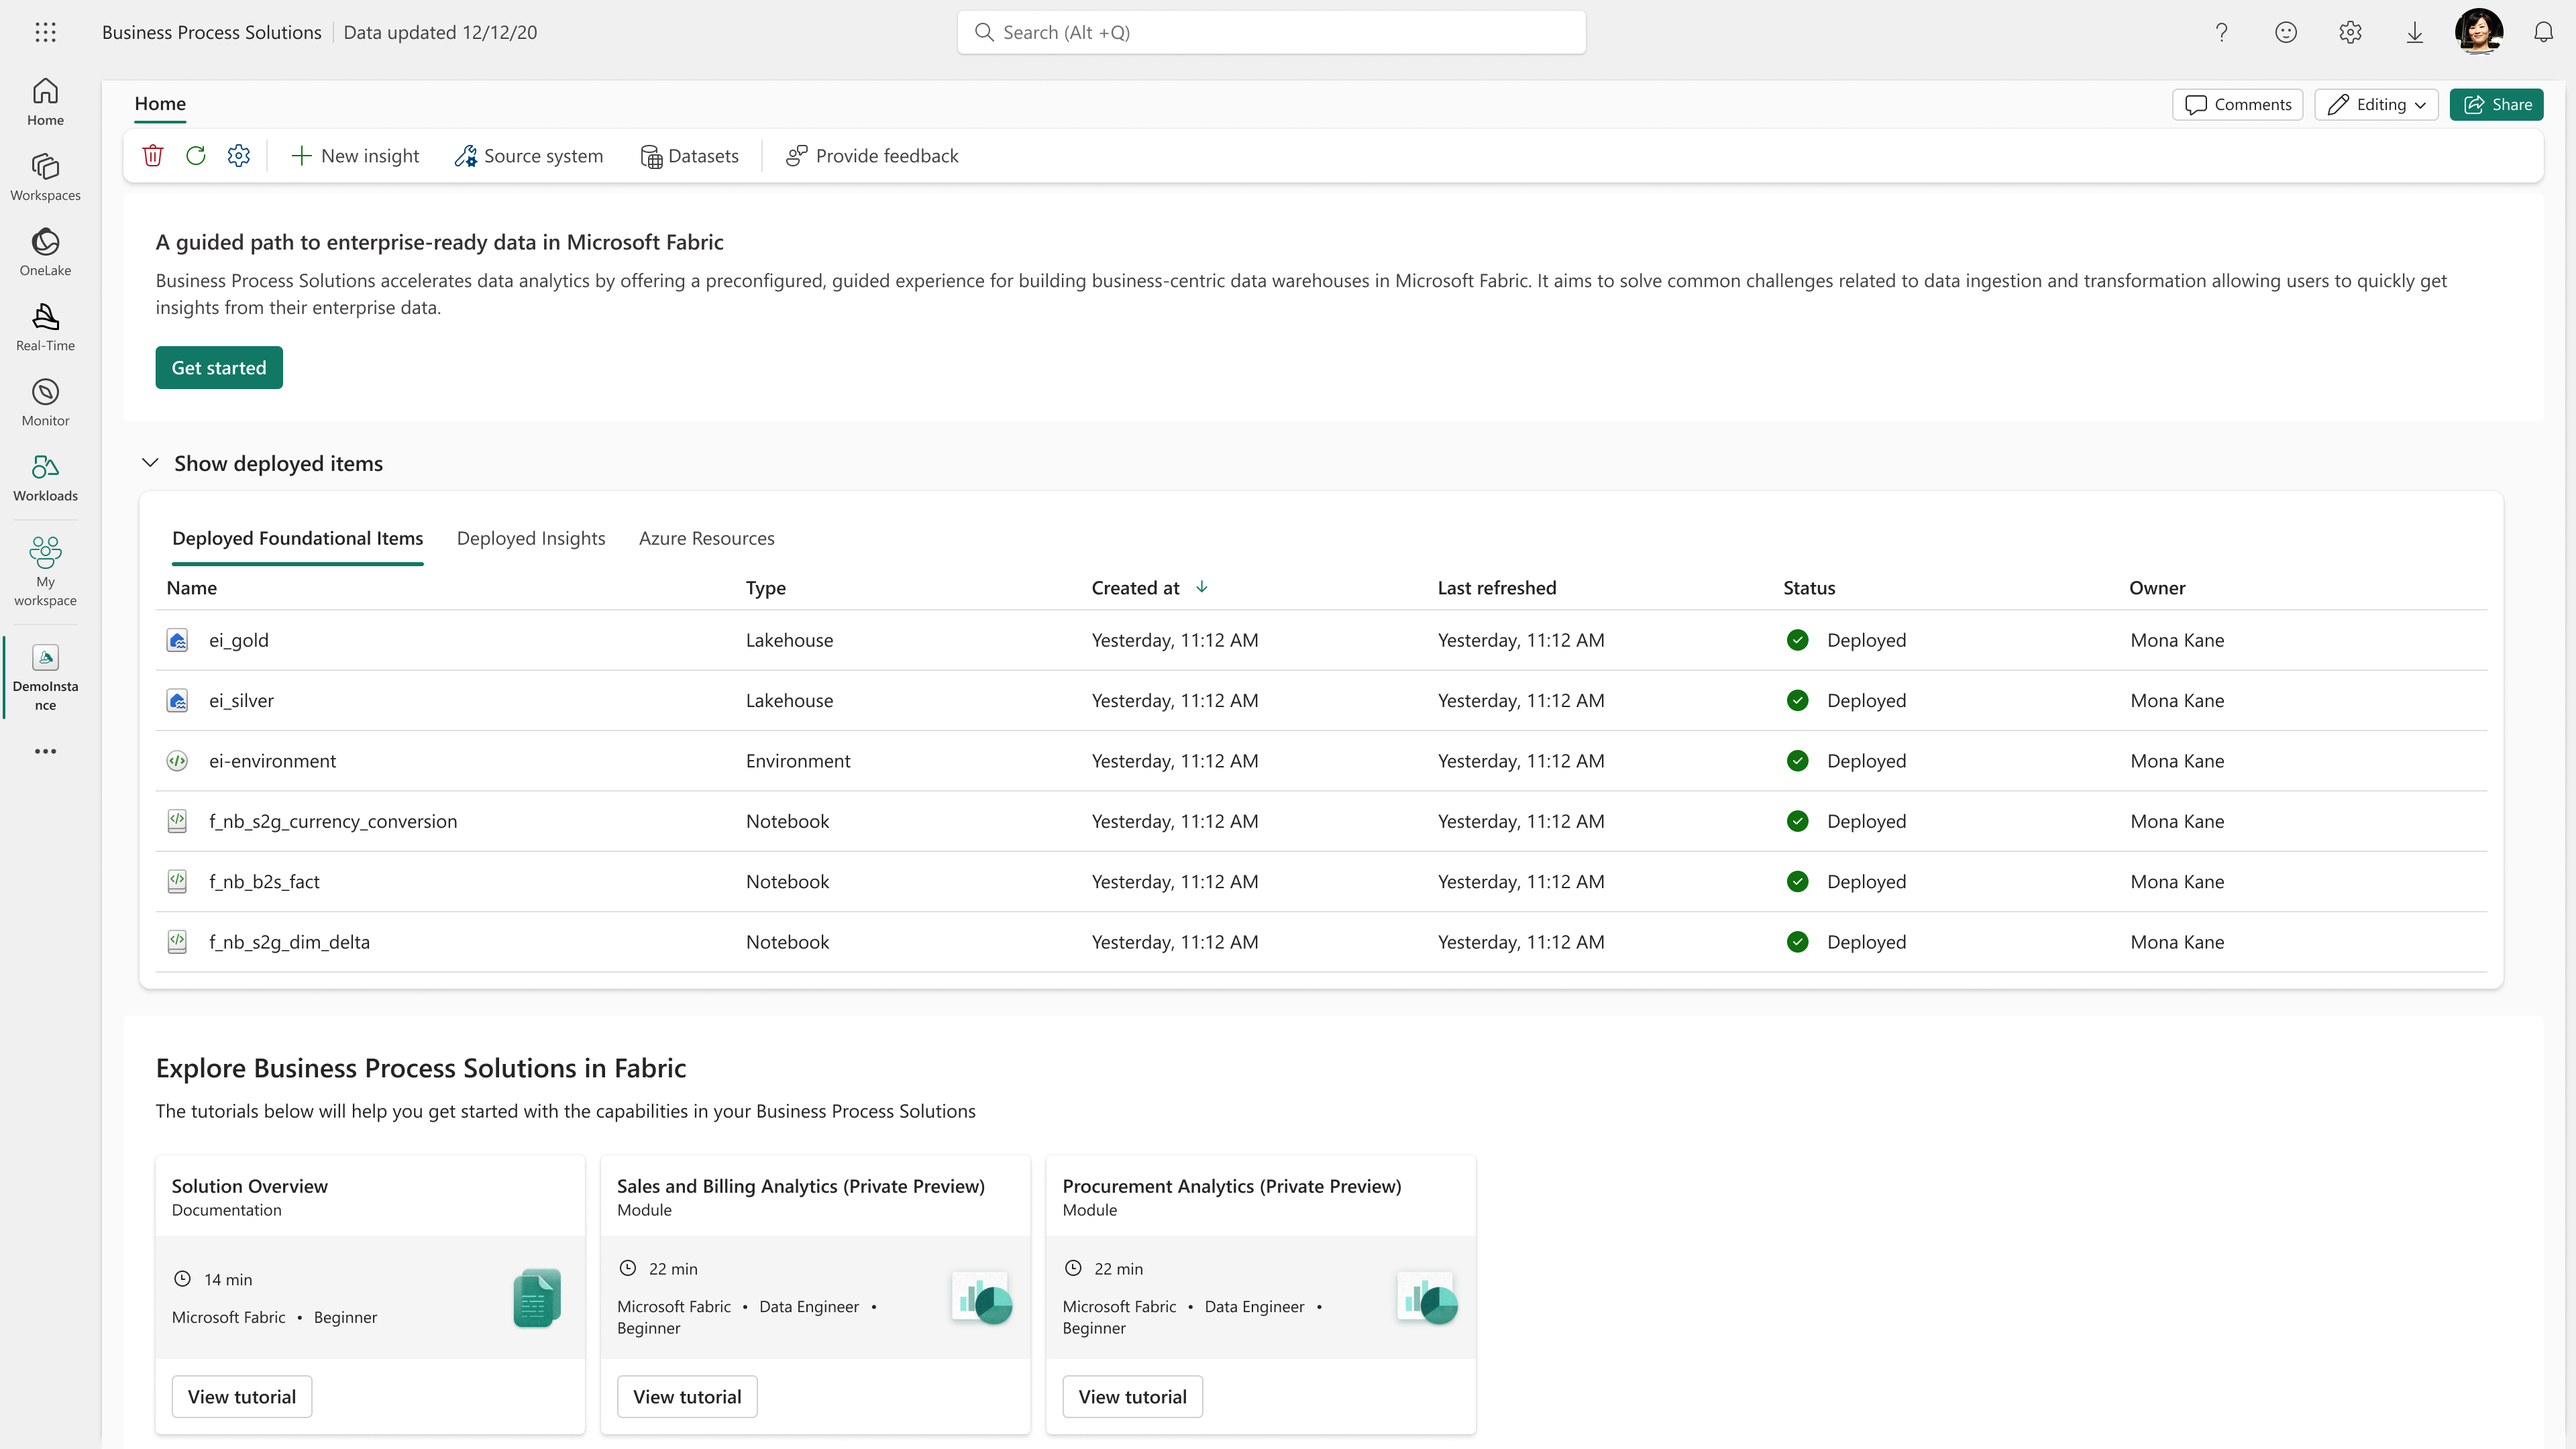
Workload landing page before there are updates to reviewWhen everything is current, the landing page confirms that items are up to dateWhen updates are available, the banner provides one place to open the update list
Key decisions & tradeoffs
Simplicity vs. enterprise configurability: Guided defaults and scenario-based setup, while keeping manual control over tables, datasets, and relationships for complex SAP estates.
Fabric standards vs. bespoke needs: Coming from Azure, I proactively worked with Fabric design stakeholders to align with platform patterns and add product-specific UI only where necessary.
Security: Credentials were removed from configuration views in favor of secure storage (e.g., Azure Key Vault) to earn enterprise trust beyond proofs of concept.
North star vs. shippable scope: I kept the agentic, Teams-first vision alive in the story, shipped the simpler implementation engineering could deliver reliably, and followed with implementation fit-and-finish.
Outcomes
Product transformation: BPS went from a technical accelerator to a native Fabric workload with guided configuration, multi-source integration, editable relationships, dashboards, and semantic models.
Public Preview: Guided configuration in a single UI replaced fragmented manual setup, and relationship management shipped as a named capability.
GA (Sept 2026): More than 100 customer pilots. The launch credited the UX team’s day-to-day work, and customers reached working SAP models and reports quickly across S/4HANA and ECC.
Vision alignment: The envisioning video aligned Product, Marketing, and Engineering leadership and shaped the move toward agentic business operations.
BY THE NUMBERS
100+customers onboarded
180+active instances
5M+records processed / day
100+deployed reports
With GA, we expect adoption to accelerate as more customers move from exploration to production.
Business Process Solutions in Microsoft Fabric: shipped experience
Reflection
BPS taught me how to design for two very different users in the same product, and how to bring an Azure design perspective into a new platform community. The consistent principle was to let users state their business intent and have the system handle as much underlying setup as possible, while staying honest about where real system differences, such as ECC, need a tailored experience.